Introduction
What if I could reduce the home delivery cost of restaurants around my city.Maybe optimize routes , cluster restaurants into similar regions and assign delivery men to each cluster. Would this help ? Lets find out.
FrugalKmeans tries to analyze this over my favorite city Lucknow,India which is known for its exquisite Awadhi Cuisine .
After-all FRUGALITY IS OPTIMAL.
DATA
I required names and addresses of all the restaurants in Lucknow. My only option was scraping data from my favorite food portal. Scrapy an open source scraping tools came very handy in getting the names of all the restaurants.There were whooping (for non-metro standard) 962 of them in Lucknow. Github-Scrap has the required scripts & instruction for doing this.
Sample scraped data:(TABLE 1)
| address | name |
|---|---|
| _____________________________________________________ | ________________________ |
| 41/47, Opposite Kendriya Vidyalaya, Vivek Khand | 180 Chocoxpress |
| 3rd Floor, Hera Plaza, Sector 8, Vikas Nagar, | 101 Temperature Lounge |
| Capital Building, GPO, Hazratganj, Lucknow | A 1 Dildar Sindhi Restaurant |
| 4th Floor, Food Court, Phoenix United Mall, Alambagh | 180 Chocoxpress |
| 5th Floor, Phoenix United Mall, Alambagh, Lucknow | 5 C R Lounge |
Coordinates
After obtaining the names and addresses of all the restraunt ,next step was to get their coordinates.Google-Geo-coding API does the trick.Just get a API KEY as instructed in aforementioned link and using coordinate.py you will get a nice list of restaurants with their coordinates.
Something like this:(Table 2)
| name | address | Lat. | Long. |
|---|---|---|---|
| __________________________________________ | ___________________________________________ | ______________________ | ___________ |
| Hera Plaza Sector 8 Vikas Nagar lucknow | Sector 8, Vikas Nagar, Lucknow, Uttar Pradesh 226022, India | 26.8906639 | 80.9670749 |
| Kamla Nehru Marg lucknow | Kamla Nehru Marg, Lucknow, Uttar Pradesh 226003, India | 26.8658443 | 80.9104684 |
| GPO Hazratganj Lucknow lucknow | Sardar Patel Park, Vidhan Sabha Marg, Raj Bhavan Colony, The Mall Avenue, Lucknow, Uttar Pradesh 226001, India | 26.8453894 | 80.9456421 |
DATA PREPROCESSING
Now we have all the data that we require to analyze our problem.But still a little trimming is required to make the available data suitable to be fed into our algorithm.
First step would be to using Pandas library to weed out the addresses & names and also fill up the NA data point if any. After data processing stage we are left with coordinates only.
Something like:(Table 3)
| Latitude | Longitude |
|---|---|
| ___________________ | ___________ |
| 26.8466937 | 80.946166 |
| 26.8466937 | 80.946166 |
| 26.8466937 | 80.946166 |
| 26.8906639 | 80.9670749 |
| 26.8658443 | 80.9104684 |
Clustering
Next step in this quest to find a frugal method for home delivery comes with the clustering of restaurants into similar geographical regions.And what is a better method then K-Means to achieve that.But there is a problem with K-Means for this dataset and it fails giving NA values as the cluster centroids, if K>4.
This is a serious issue pretaining to K-Means therefore I somehow settled for ‘Bi-KMeans’ or Bisecting KMeans clustering algorithm which is a little different form the traditional K-means algorithm in following ways.
k-means sometimes gives poor results if it is caught in a local minimum.Therfore another algorithms called bisecting k-means is developed. It starts with choosing one random centroid and distance from all the points is calculated as sum of square error or SSE. While number of centroids are less then K(user defined number of clusters) algorithms recursively splits the above cluster into many clusters based on the least SSE error for the split.
After aplying Bisecting K-means clustering algorithm(Github-BiKmeans.py) to the data in Table3 we get another list of data points with two features “the cluster they belong to” and “distance from corresponding centroid” . A sample data from after transformation :
| Cluster | SSE or distance |
|---|---|
| _________ | __________________ |
| 8 | 0.5886538506 |
| 3 | 0.0241409154 |
| 3 | 0.0107502713 |
| 3 | 0.0107502713 |
| 7 | 0.2401804062 |
| 0 | 0.1848409829 |
Results and Visualizations
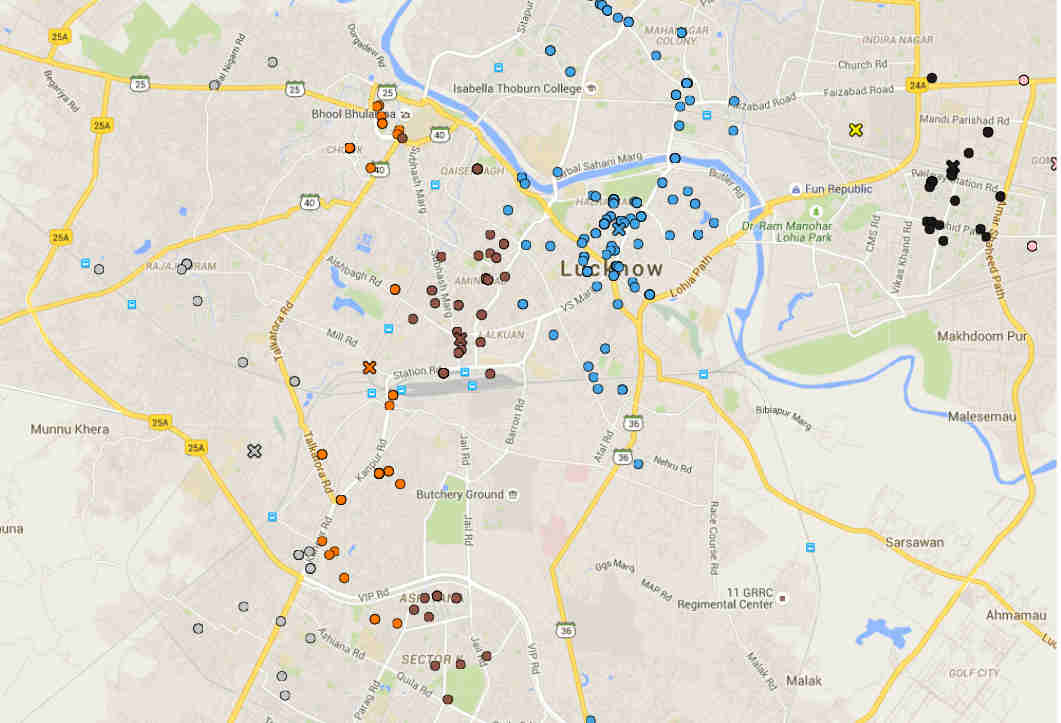
Hamstermap is a beautiful online tool for plotting map coordinates but since it accepts a specific format we need to do a little Data munging for that. A python script(frugalKmeans.py) I have written does the same very efficiently .After transforming the data with above script we are left with the following list of data points :
| latitude | longitude | marker | color |
|---|---|---|---|
| _________________ | ____________ | _________ | ________ |
| 26.8466937 | 80.946166 | circle1 | blue |
| 26.8466937 | 80.946166 | circle1 | blue |
| 26.8906639 | 80.9670749 | circle1 | blue |
| 26.8658443 | 80.9104684 | circle1 | orange |
| 26.8453894 | 80.9456421 | circle1 | blue |
| 26.8466937 | 80.946166 | circle1 | blue |
| 26.8466937 | 80.946166 | circle1 | blue |
| 26.8532449 | 80.9965217 | circle1 | black |
Exporting this to Hamstermap and plotting the required coordinates gives the centroids(where delivery boys should be stationed) and respective restaurants they would service from.
After some exploratory data-analysis we come up with following map.